Atop
Atop is an advanced system and process monitor for Linux providing comprehensive resource utilization tracking with persistent logging capabilities. This document describes practical approaches for deploying atop in HPC environments and using it for post-mortem system diagnostics.
Overview
Atop is a full-screen performance monitor combining real-time resource observation with persistent logging capabilities. Unlike traditional monitoring tools such as top, atop records all process activity to disk, enabling post-mortem analysis of historical system states.
Value Proposition
- Historical analysis capability:
Persistent logging enables backtracking: “What consumed resources during yesterday’s job failure?”
Daily compressed logs with configurable retention (default 28 days)
Crash-surviving logs ensure data availability even after system failures
10-minute interval snapshots (configurable) balance granularity with storage overhead
- Complete process accounting:
Records resource consumption of processes that completed during measurement intervals
Short-lived processes visible despite completing between observation intervals
Per-process CPU, memory, disk I/O, and network statistics (with netatop module)
User attribution tracks resource consumption per user
- Multi-resource coverage:
Comprehensive tracking: CPU, memory, swap, disk I/O, network utilization
System-level and per-process granularity
cgroup-aware monitoring with pressure stall information (PSI)
Visual indicators highlight critical resource saturation
- Subsystem identification:
Rapid identification of resource bottlenecks (CPU/memory/disk/network)
Localization before detailed tracing reduces diagnostic time
Serves as first-line diagnostic tool before invoking tracing utilities
- Limitations acknowledged:
Sub-interval resolution limited: Transient issues lasting seconds may not appear in default 10-minute snapshots
No code-level detail: Identifies resource saturation but not specific functions or system calls
Historical logging only: Not a real-time alerting system (use Prometheus/Grafana for alerts)
Learning Curve
Difficulty: Medium
Atop’s setup is straightforward - package installation and service activation complete within minutes. The learning challenge lies in mastering the extensive command set for different diagnostic scenarios. Atop provides dozens of interactive commands for view switching, process filtering, resource sorting, and time navigation.
System administrators may initially feel overwhelmed by interface density and command variety. Start with basic real-time observation (atop with default view), then gradually explore historical log analysis (atop -r) and view switching (m for memory, d for disk, n for network). Competency develops through repeated use across actual diagnostic scenarios rather than memorizing all available commands upfront.
Recommendation: Begin with simple log backtracking workflows: user reports issue → identify timestamp → review atop logs → identify resource bottleneck. Build intuition through repeated diagnostics before exploring advanced filtering and aggregation features.
Data Collection Model
Interval-Based Sampling
Atop employs interval-based sampling rather than continuous streaming. Every N seconds (default 600), atop captures a snapshot of system and process state, then compresses and writes this data to persistent storage.
Default configuration:
Interval: 600 seconds (10 minutes)
Retention: 28 days
Storage: ~10-50 MB per day per system (compressed)
Location:
/var/log/atop/atop_YYYYMMDD
Interval trade-offs:
Shorter intervals (60s, 120s): Capture transient issues, increased overhead and storage
Longer intervals (900s, 1800s): Reduce overhead, risk missing short-duration anomalies
Default 10 minutes: Balances diagnostic utility with operational overhead for most HPC environments
Process Lifecycle Tracking
Atop records all processes active during each interval, including:
Running processes: Currently executing at snapshot time
Finished processes: Completed since previous snapshot (cumulative resource usage)
Zombie processes: Terminated but not yet reaped by parent
This complete accounting ensures short-lived processes remain visible in logs despite completing between snapshots.
Installation and Setup
Prerequisites
Software requirements:
Linux operating system with systemd (RHEL/Rocky/AlmaLinux, Ubuntu/Debian, SUSE)
Kernel 2.6.28 or later (for process accounting)
zlib compression library (typically pre-installed)
Storage requirements:
Compressed logs: 10-50 MB per day per system
28-day retention: ~1-2 GB per system
Location:
/var/log/atop/
Package Installation
RHEL/Rocky/AlmaLinux:
# Install core atop package
sudo dnf install atop
Debian/Ubuntu:
# Install core atop package
sudo apt install atop
Persistent Logging Configuration
Atop requires systemd service activation to enable persistent logging. Without this configuration, atop functions only as a real-time monitoring tool.
# Enable and start atop logging service
sudo systemctl enable --now atop

# Verify service status
systemctl status atop

# Check log directory
ls -lh /var/log/atop/
Verify logging is active:
# Current day's log should exist
ls -lh /var/log/atop/atop_$(date +%Y%m%d)

# View recent snapshot
atop -r
Configuration Tuning
Default retention is 28 days with 600-second (10-minute) intervals. Modify /usr/share/atop/atop.daily to adjust:
# Retention period (number of daily logs to retain)
LOGGENERATIONS=28

# Sampling interval in seconds (default 600 = 10 minutes)
LOGINTERVAL=600       # Reduce for finer granularity, increase for lower overhead
Configuration trade-offs:
Lower intervals (60s, 120s): Capture transient issues, increased CPU overhead and storage
Higher intervals (900s, 1800s): Reduced overhead, risk missing short-duration anomalies
Default 10 minutes: Balances diagnostic utility with operational overhead
After modifying configuration, restart the service:
sudo systemctl restart atop
Basic Usage
Understanding Atop’s Display
Atop’s interface consists of two main sections:
System Resource Panel (upper): Subsystem-level metrics (CPU, memory, disk, network)
Process List (lower): Per-process resource consumption
The recommended starting view combines fixed system resources with active process filtering:
atop -f
The -f flag fixes the system resource panel at the top while allowing interactive process list navigation. This provides stable reference metrics while exploring process details.
System Resource Panel:
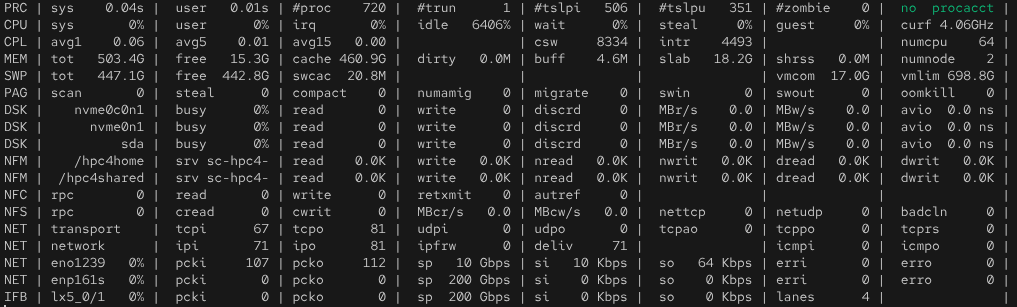
The panel displays interval statistics across multiple resource types:
PRC: Process lifecycle (running, sleeping, zombie processes)
CPU: CPU utilization breakdown (system, user, idle, wait)
CPL: CPU load averages (1, 5, 15 minutes)
MEM: Memory usage (total, free, cache, buffers, slab)
SWP: Swap usage and virtual memory
PAG: Page scanning and swapping activity
DSK: Per-disk I/O statistics
NFM/NFC: NFS mount statistics (if applicable)
NET: Network interface and protocol statistics
System Resource Panel Metrics
PRC (Process) Line:
sys: Total system (kernel) CPU time consumed during intervaluser: Total user-space CPU time consumed during interval#proc: Total processes tracked (includes finished processes)#trun: Currently running processes (actively executing on CPU)#tslpi: Interruptible sleep - normal idle state#tslpu: Uninterruptible sleep - blocked on I/O (high values indicate I/O bottlenecks)#zombie: Zombie processes (usually harmless unless persistent)clones: Process/thread creation rate per second
CPU Line:
sys: Percentage in system/kernel modeuser: Percentage in user modeirq: Interrupt handling overheadidle: Idle time (higher = less utilized)wait: Waiting for disk I/O (high values indicate I/O saturation)steal: CPU cycles stolen by hypervisor (virtualized environments)curf: Current CPU frequencynumcpu: Number of CPUs
MEM (Memory) Line:
tot: Total physical memoryfree: Unused memorycache: Page cache (file system caching)dirty: Modified pages not yet written to diskbuff: Buffer cacheslab: Kernel data structuresslrec: Reclaimable slab memory
DSK (Disk) Line:
busy: Percentage time disk was activeread/write: Operations per secondMBr/s, MBw/s: Throughput in MB/secondavio: Average I/O time (high values indicate slow disk)
NET (Network) Lines:
transport: TCP/UDP packet countsnetwork: IP layer statisticsinterface: Per-interface packet rates and bandwidthsp: Link speedsi/so: Incoming/outgoing bandwidth (Kbps, Mbps, Gbps)
Use Case: Real-Time Diagnostics
Real-time monitoring identifies issues as they occur, providing immediate visibility into system behavior.
Launch Real-Time View
Start atop with fixed system panel:
atop -f
Example: Identifying CPU Saturation
User reports: “System feels slow right now”
Launch
atop -fObserve CPU line:
waitpercentage high?Cross-validate with related metrics:
DSK line: Check if any disk shows
busynear 100%, highaviolatencyNFM/NFC lines: If NFS is involved, check for high request rates or slow response
PAG line: Check for non-zero
scanorstall(memory pressure causing swap I/O)
If disk I/O confirmed:
Press
dto switch to disk viewIdentify which disk (local or NFS mount) shows saturation
Press
Dto sort processes by disk I/OIdentify processes generating excessive I/O (read/write operations)
Note: High CPU wait with low disk busy may indicate network-mounted filesystem issues (NFS, SMB) where I/O requests queue remotely rather than at local disk.
Use Case: Post-Mortem Analysis
Atop’s primary value for HPC diagnostics lies in historical log backtracking. When issues occurred in the past, atop logs enable root cause analysis.
Diagnostic Workflow
User reports: “My job was slow yesterday at 14:30”
Step 1: Load historical logs
# Yesterday's logs
atop -r /var/log/atop/atop_$(date -d yesterday +%Y%m%d)

# Specific date (example: December 15, 2025)
atop -r /var/log/atop/atop_20251215
Step 2: Navigate to timestamp
After launching atop -r:
Press
b(jump to specific time)Enter
14:30when promptedSystem displays snapshot nearest to 14:30
Step 3: Identify resource bottleneck
Review system resource panel (top section):
High CPU
wait? → Disk I/O issueLow
freememory, highscan? → Memory pressureHigh network interface
busy? → Network saturationHigh
#tslpu? → Processes blocked on I/O
Step 4: Switch views for detail
Press
mfor memory detailsPress
dfor disk I/O detailsPress
nfor network details
Step 5: Identify culprit process
Press
Cto sort by CPUPress
Mto sort by memoryPress
Dto sort by disk I/OPress
uto aggregate by userPress
pto aggregate by program
Step 6: Establish timeline
Press
Tto go backward in timePress
tto go forward in timeObserve when bottleneck started/ended
Command-Line Filtering
Preset views and filters via command-line flags:
# Sort by CPU during log review
atop -r -C

# Sort by memory
atop -r -M

# Sort by disk I/O
atop -r -D

# Show only specific user's processes
atop -r -U username

# Aggregate by program
atop -r -p
Command-Line Options by Category
Command-line options establish the initial view and behavior. All can be overridden interactively at runtime.
Activity focus (select resource view):
atop -f      # Full system panel (all subsystems visible)
atop -m      # Memory-focused view
atop -d      # Disk I/O-focused view
atop -n      # Network-focused view (requires netatop kernel module)
atop -s      # Scheduling information (priority, nice, state)
atop -v      # Various details (PPID, user/group, timestamps)
atop -c      # Full command lines
Sorting (process ordering):
atop -C      # Sort by CPU consumption (default)
atop -M      # Sort by memory consumption
atop -D      # Sort by disk I/O activity
atop -N      # Sort by network I/O (requires netatop)
atop -A      # Automatic sorting by most active resource
Aggregation and filtering:
atop -u      # Aggregate by user (show per-user totals)
atop -p      # Aggregate by program name (group identical commands)
Display options:
atop -1      # Show per-second averages instead of interval totals
atop -a      # Show all processes (including inactive)
atop -y      # Show threads within processes

atop 5       # Update every 5 seconds (last argument = interval)
Common combinations:
# Memory investigation with per-second updates
atop -f -m -A -1 1

# Per-user CPU usage
atop -u -C 2

# Disk activity by program
atop -p -D -1 1
Interactive Commands
Atop supports runtime view switching via keyboard shortcuts:
Resource view selection:
g: Generic (default) - CPU and memory overviewm: Memory details - detailed memory consumptiond: Disk details - per-disk I/O statisticsn: Network details - network interface and per-process network (if netatop loaded)s: Scheduling information - priority, policy, statev: Various details - PPID, user/group, timestampsc: Command line - full process command lines
Process sorting:
C: Sort by CPU consumptionM: Sort by memory consumptionD: Sort by disk I/ON: Sort by network I/O (requires netatop)A: Sort by overall activity (automatic)
Process filtering:
u: Aggregate by user - show per-user resource totalsp: Aggregate by program name - show per-application totalsU: Filter by specific user (prompts for username)P: Filter by specific program (prompts for program name)
Navigation:
t: Forward in time (when viewing logs)T: Backward in time (when viewing logs)b: Jump to specific timestamp (when viewing logs)q: Quit
Advanced Usage
Per-Process Network Statistics (netatop)
The optional netatop kernel module enables per-process network statistics, showing which process sends/receives network traffic. This requires kernel module compilation and loading.
Note: Most HPC diagnostic scenarios don’t require per-process network attribution. System-level network statistics (available without netatop) suffice for identifying network saturation or interface issues. Per-process network tracking is rarely needed in practice.
Skip netatop unless:
You need to identify which specific process generates network traffic
Per-process network I/O attribution is critical for your use case
System-level network statistics prove insufficient for diagnostics
If per-process network accounting is required, consult official documentation at https://atoptool.nl/ for installation instructions. The module requires kernel headers, compilation tools, and careful integration with system kernel updates.
Best Practices
Operational Guidelines
Interval selection:
Default 10 minutes balances diagnostic utility with overhead
Reduce to 2-5 minutes for systems with frequent transient issues
Increase to 15-30 minutes for stable systems with storage constraints
Log retention:
Default 28 days provides good coverage for most diagnostic needs
Increase for systems requiring longer historical analysis
Compress old logs externally if extending retention beyond defaults
Storage management:
Monitor
/var/log/atop/disk usageAllocate 1-2 GB per system for 28-day retention
Consider centralized log collection for multi-system environments
Integration with diagnostic workflows:
Real-time issues: Start with monitoring dashboards (Prometheus/Grafana)
Historical issues: Start with atop logs
Atop identifies culprit: Use tracing tools (strace, perf) for code-level detail
System-wide issues: Investigate hardware/kernel (journalctl, dmesg)
Limitations awareness:
Atop logs interval snapshots, not continuous streams
Transient issues lasting seconds may not appear in logs
For sub-interval resolution, use continuous tracing (perf record, eBPF)
References and Resources
Official Documentation
Main documentation: https://atoptool.nl/ - Official project site with manpages, feature descriptions, and configuration guides
Screenshots and visual guide: https://atoptool.nl/screenshots.php - Annotated examples of various atop views
System reports and usage examples: https://atoptool.nl/systemreports.php - Real-world output interpretation patterns
Source repository: https://github.com/Atoptool/atop - Issue tracking and development
Additional Resources
Man pages:
man atop,man atopsar(included with package) - Authoritative reference for all optionsRelated diagnostic tools: Testing and Validation - Overview of complementary validation and tracing tools